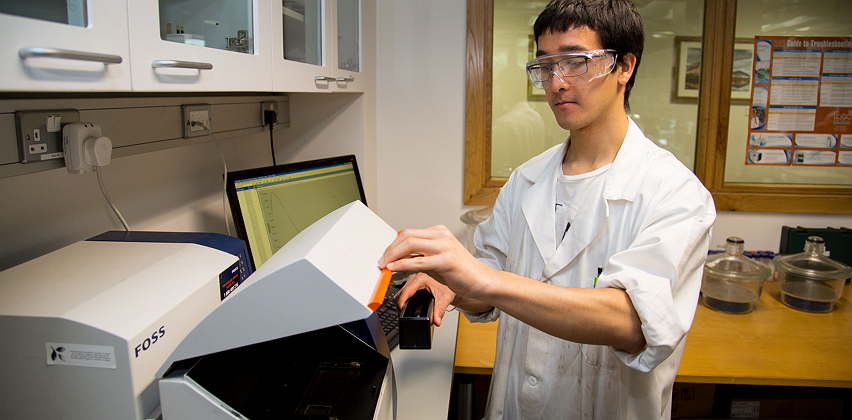
Rapid Near Infrared Analysis of Biomass
Celignis has developed unique proprietary models that allow the lignocellulosic composition of biomass samples to be predicted from their near infrared (NIR) spectra. This service is offered in
Analysis Package P11 (NIR Prediction Package). That Package provides the following advantages over the standard wet-chemical methods for analysis:
| |
Rapid Analysis:
| |
We typically provide data within one day of receipt of the samples. |
Lower Cost:
| |
The NIR method involves less laboratory work than the wet-chemical analytical methods which allows us to provide the service at a lower cost. |
Effective Sample Screening:
| |
As a result of the increased speed and reduced cost of analysis the NIR method allows a far greater number of samples to be analysed than would otherwise be possible with standard methods. This means that you can screen more samples in order to find those that are most appropriate for your desired end-use. |
|
Analytes Determined
We have developed NIR models for a range of compositional parameters of importance for the production of advanced biofuels. These parameters are listed below, click on an entry to see statistics concerning the accuracy of the NIR model in predicting that constituent.
These models have been developed based on wet-chemical data obtained from biomass samples that have had their ethanol-soluble extractives removed and then been put through an acid-hydrolysis process to determine their sugars and lignin composition.
Biomass Types
The data and spectra of thousands of samples have been used to construct our NIR models. Listed below are just some of the biomass types that have been used to build these models.
By covering such a wide variety of biomass feedstocks, and with numerous samples collected for each feedstock
(covering different conditions such as: plant variety, time of year, productivity, and region/environment), our models are highly robust and able to predict the composition of
any lignocellulosic sample.
Energy
Crops
Agricultural Residues and Wastes
Industrial Residues and Wastes
Municipal
Wastes
Biorefinery
Products
Confidence in Our Analysis
We use formulae to estimate the
Deviation in Prediction for the compositonal values that our NIR models predict.
This deviation represents a form of a confidence interval with regards to the prediction. For example, a deviation of 1% in a predicted Klason lignin content of 15% suggests that the real Klason
lignin content of the sample is likely to be in the range of 14-16%. Approximately 95% of the samples in our independent prediction set had actual compositional values, determined by wet-chemistry,
that were within the range of the NIR predicted value +/- 2 times the Deviation in Prediction.
At Celignis, we pride ourselves on the accuracy and precision of our analysis. Customer satisfaction is of paramount importance. For our
NIR Analysis Package, if we
find that the deviation in prediction is relatively high (defined as a value over 3% for the
total lignocellulosic sugars content) then we will undertake the
chemical analysis of that sample at no extra charge and provide you with all of the data that we obtain in this analysis. This chemical analysis will cover the analysis packages that we used to
develop our NIR models:
P3 - Ash Content,
P4 - Ethanol Extractives,
and
P9 - Lignocellulosic Sugars and Lignin.