


Simplifying the Process of Biomass Analysis
We realise how important your samples are and your need to access data as quickly and as easily as possible. That is why we created the Celignis Database. This is a password-protected website where you can place your orders and view the results of our analysis, even when the order itself has not been fully completed.
The database is responsive to use on laptops, tablets, and mobile phones and helps to take the complexity out of the process of selecting which of our analysis packages are the most suitable for your samples.
We present summary results as well as detailed data for each sample with results represented in tabular and graphical forms. We also use the compositional data to estimate the potential biofuel yields from your samples. Data relevant to thermal processing are shown on dry-mass, as-received, and dry-ash-free terms.
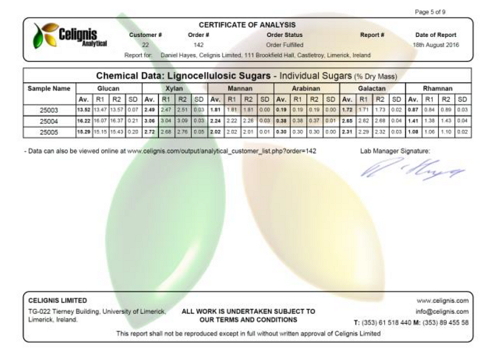
You can download the data any time from the Database as Excel and PDF reports. We also send you final reports by email once we have completed our analysis. These reports provide data for each of the duplicates analysed, the average, and the standard deviation, so that you can see the precision of our analysis.
You can view example data on our guest account, enter user test@celignis.com and password celignis here.
Using the Database
Step by step instructions for using this database are provided below:Step 1: Register
You can log on to the database as a guest and see example results. Simply go to the login page and type "test@celignis.com" and "celignis" (excluding the quotation marks) in the "Email" and "Password" fields, respectively. You can then observe a number of analytical results as described below.
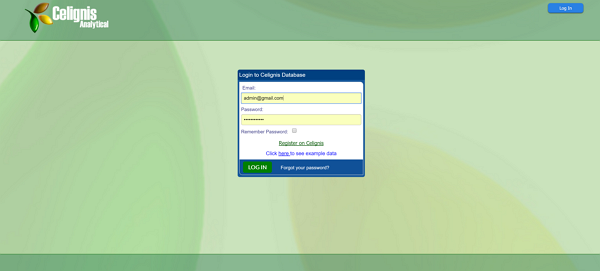
However, to place orders and to view the data for your own samples you need to register on the site. To do this, click "Register on Celignis" on the login page or go directly to the registration page via this link.
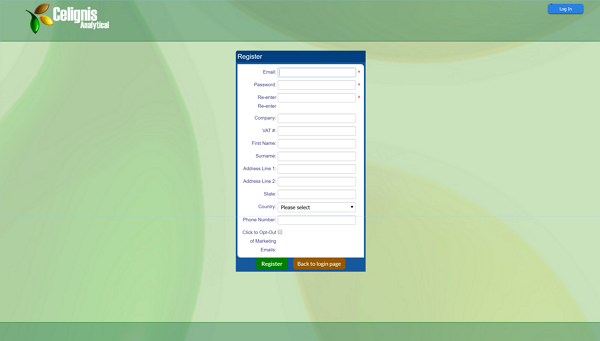
The registration page requires you to input your email and password and, if applicable, information on your company. Following successful registration you will receive an automated email from Celignis and will then be allowed to login using the email and password you provided. Clicking "Remember Password" on the login page will allow automated logins in the future.
Step 2: Input an Order
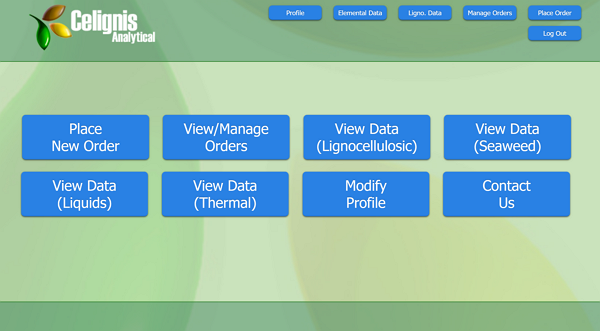
After logging in you will be directed to the Menu Page. From here you can choose to Place Orders, View and Modify Orders (if these exist), View Analytical Data (if appropriate), and Modify your Profile.
Click the "Place New Order" button to go to the New Order page. This page presents a table with each line representing each sample that will be sent for analysis. Initially it will be empty since no samples have been added. To add a sample click the "Add New" button and the following screen will pop up:
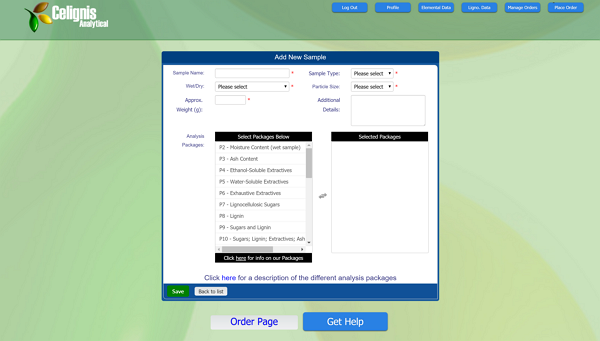
This page requires the following details to be entered:
|
Once the data have been input for a sample, pressing the "Save" button will add that sample to the list for the current order. More samples can then be added to the order by pressing the "Add New" button and entering data for each sample, as outlined above. The data provided for samples in the list can be edited by pressing the "Edit" button and samples can be removed from the order list by highlighting them and pressing "Delete Selected".
Step 3: View/Manage Orders
This page lists all of the orders that the user has placed with Celignis. It displays: the order number; the number of samples in each order; when the order was last modified; and the current status of the order. Depending on the status there are a number of actions that can be taken for each order. The different order statuses, and what actions they allow the user to carry out, are outlined below:
|
Step 4: View Analysis Data
Once we have uploaded data for your samples you are able to view these data through the Celignis Database, even if analysis for the whole order has not yet been completed. This flexibility allows you quick and easy access to your data. A number of different data pages are present on the Celignis Database, according to the analysis packages that have been chosen. These are described below.
View Lignocellulosic Data
You can view a table summarising the lignocellulosic data for an order by clicking the "View Cellulosic Data" button on the Orders page. Alternatively, you can view the lignocellulosic data for all orders by clicking the "Ligno. Data" button on the top of the page or the "Show All Samples" button if you are viewing lignocelluloisic data for a specific order.
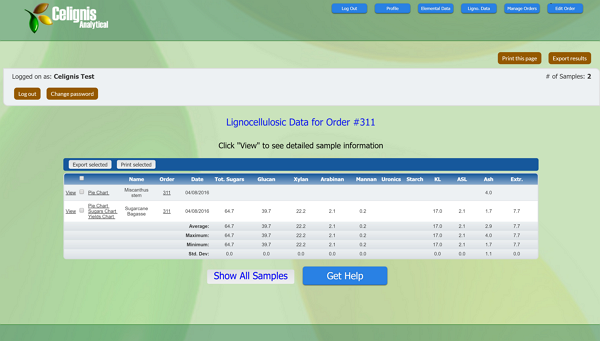
This table presents data for the most important analytes in the lignocellulosic analysis packages. All data are presented as a percentage of the total dry mass of the sample. Shorthand abbreviations are used for some analytes (e.g. KL = Klason lignin, ASL = acid soluble lignin, Extr. = extractives). The table also presents summary statistics for all the samples in the list, including the average, maximum, minimum, and standard deviation for each analyte. The order of samples in the table can also be sorted for each analyte by clicking its name.
The table has a column indicating the order associated with each sample. Clicking this number will filter the table to only display the samples in that order. You can click the "Show all Samples" button at the bottom of the page to show the lignocellusic data for all orders.
There are three charts that can be accessed for each sample on this page. These are described below:
Pie Chart - Containing data for all the lignocellulosic analytes. The "Unknown" value is calculated as 100% minus all the analytes that have currently been determined. This value may change as more data are uploaded.
Sugars Chart - This expresses the percentage that each of the lignocellulosic sugars contributes to the total lignocellulosic sugars content.
Yields Chart - We use a number of formulae to calculate, based on the compositional data we obtain in our analysis, the potential biofuel yields that may be achieved if the sample were to be processed in a number of representative biorefining technologies. These technologies, and the formulae we use, are dscribed in detail here. Please note that the yields provided are only calculated estimates, the actual yields of biofuel when processing your sample in such technologies may differ.
On the left hand side of the table there is a link labelled View, if you click this then you will go to a specific web page that provides much more detail on the analysis undertaken for that sample. Where analysis has been undertaken in duplicate it provides data for each of the replicates, as well as the average and standard deviation between these.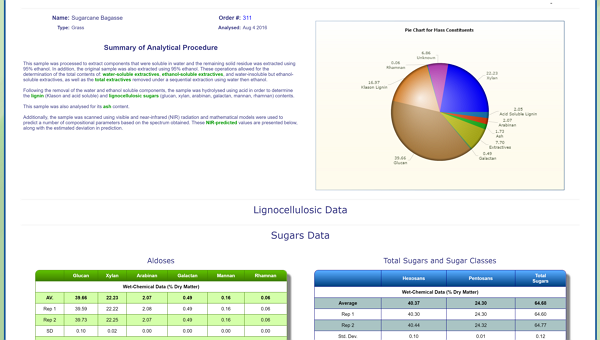
At the top and bottom of this page you can click on arrows to go forward and backward to see the respective pages for other samples in that order. You can also click on buttons to jump to the section of most interest on the page (e.g. "Biofuel Yields").
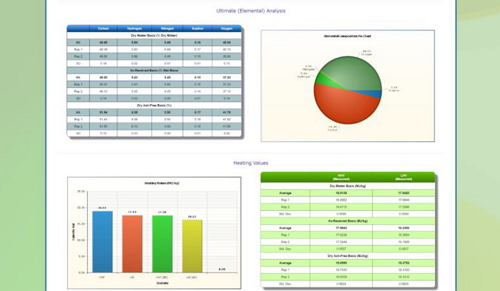
View Thermal Data
You can view a table summarising the thermal data for an order by clicking the "View Thermal Data" button on the Orders page. Alternatively, you can view the thermal data for all orders by clicking the "Thermal Data" button on the top of the page or the "Show All Samples" button if you are viewing thermal data for a specific order.
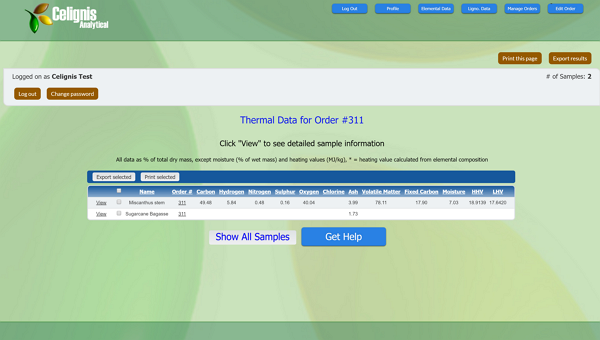
This table presents data for the most important analytes in the thermal analysis packages. All data are presented as a percentage of the total dry mass of the sample, with the exception of moisture content (expressed in terms of the percentage of total wet mass of the sample, i.e. on a wet basis) and the heating values (expressed in terms of MJ per dry kg of the sample). Shorthand abbreviations are used for some analytes (e.g. HHV = higher heating value (also known as gross calorific value), and LHV = lower heating value (also known as net calorific value)).
The table has a column indicating the order associated with each sample. Clicking this number will filter the table to only display the samples in that order. You can click the "Show all Samples" button at the bottom of the page to show the thermal data for all orders.
On the left hand side of the table there is a link labelled View, if you click this then you will go to a specific web page that provides much more detail on the analysis undertaken for that sample. Where analysis has been undertaken in duplicate it provides data for each of the replicates, as well as the average and standard deviation between these. This page presents the thermal data on three bases: dry matter, as-received, and dry-ash-free.
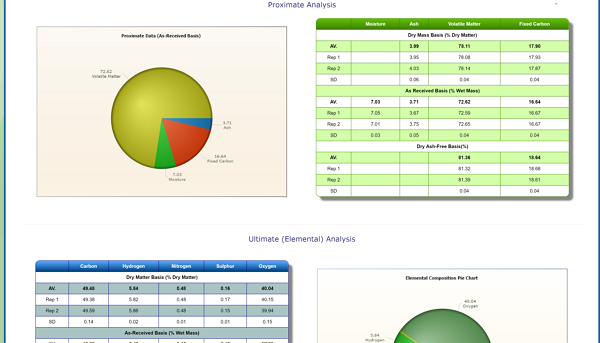
At the top and bottom of this page you can click on arrows to go forward and backward to see the respective pages for other samples in that order. You can also click on buttons to jump to the section of most interest on the page.
This sample detail page also presents estimated biofuel yields for the sample, considering a number of representative biorefining technologies. These values are calculated at Celignis using a number of formulae that consider the the compositional data we obtain in our analysis and the relative efficiencies of the particular technology. These technologies, and the formulae we use, are dscribed in detail here. Please note that the yields provided are only calculated estimates, the actual yields of biofuel when processing your sample in such technologies may differ.
View Liquids Data
You can view a table summarising the liquids data for an order by clicking the "View Liquids Data" button on the Orders page. Alternatively, you can view the liquids data for all orders by clicking the "Liquids Data" button on the top of the page or the "Show All Samples" button if you are viewing liquids data for a specific order.
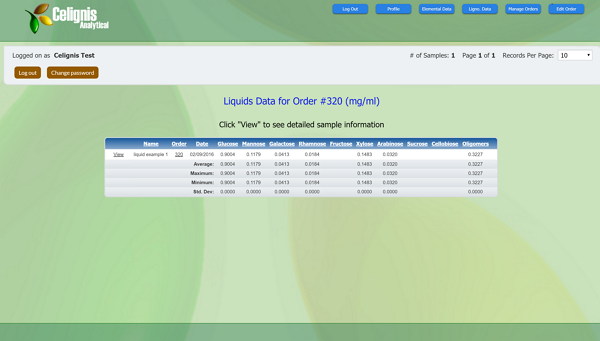
This table presents data for the most important analytes in the liquids analysis packages. All data are presented in terms of mg of analyte per ml of sample. The table also presents summary statistics for all the samples in the list, including the average, maximum, minimum, and standard deviation for each analyte. The order of samples in the table can be sorted for each analyte by clicking its name.
The table has a column indicating the order associated with each sample. Clicking this number will filter the table to only display the samples in that order. You can click the "Show all Samples" button at the bottom of the page to show the liquids data for all orders.
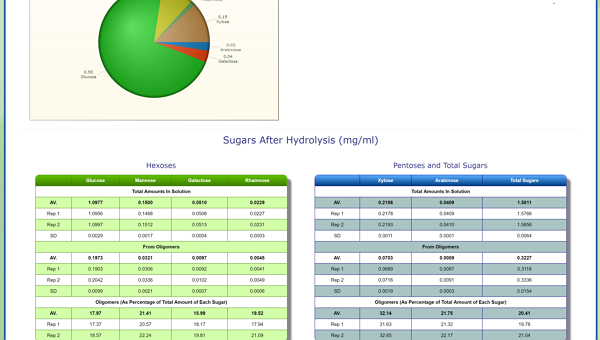
On the left hand side of the table there is a link labelled View, if you click this then you will go to a specific web page that provides much more detail on the analysis undertaken for that sample. Where analysis has been undertaken in duplicate it provides data for each of the replicates, as well as the average and standard deviation between these. Click here for more detail on the data presented for carbohydrates and oligomers and here for more detail on the data provided for sugar degradation products.
At the top and bottom of this page you can click on arrows to go forward and backward to see the respective pages for other samples in that order.
View Seaweed Data
You can view a table summarising the seaweed data for an order by clicking the "View Seaweed Data" button on the Orders page. Alternatively, you can view the seaweed data for all orders by clicking the "Seaweed Data" button on the top of the page or the "Show All Samples" button if you are viewing seaweed data for a specific order.
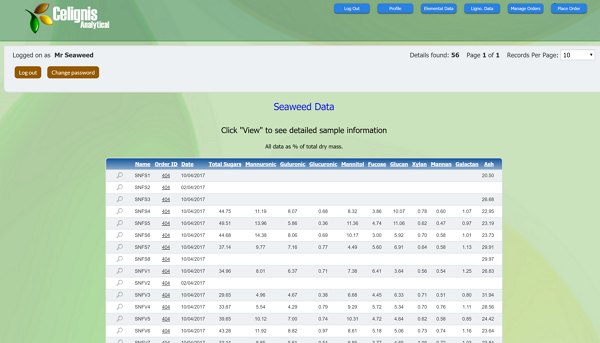
This table presents data for the most important analytes in the seaweed analysis packages. All data are presented as a percentage of the total dry mass of the sample. The order of samples in the table can be sorted for each analyte by clicking its name.
The table has a column indicating the order associated with each sample. Clicking this number will filter the table to only display the samples in that order. You can click the "Show all Samples" button at the bottom of the page to show the seaweed data for all orders.
On the left hand side of the table there is a link labelled View, if you click this then you will go to a specific web page that provides much more detail on the analysis undertaken for that sample. Where analysis has been undertaken in duplicate it provides data for each of the replicates, as well as the average and standard deviation between these. Click here for more detail on the data presented for seaweed.
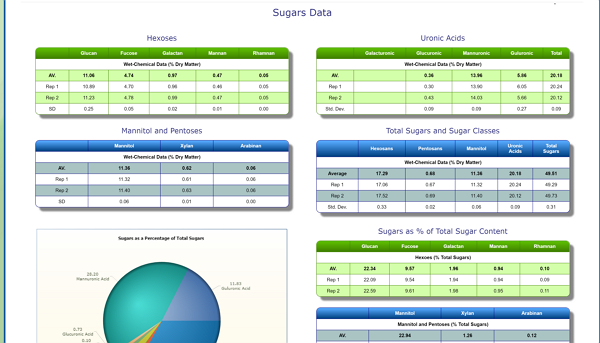
At the top and bottom of this page you can click on arrows to go forward and backward to see the respective pages for other samples in that order.
Step 5: Modify Your User Profile
This page can be reached by clicking the "Modify Profile" button on the menu page or the "Profile" button at the top of the page.
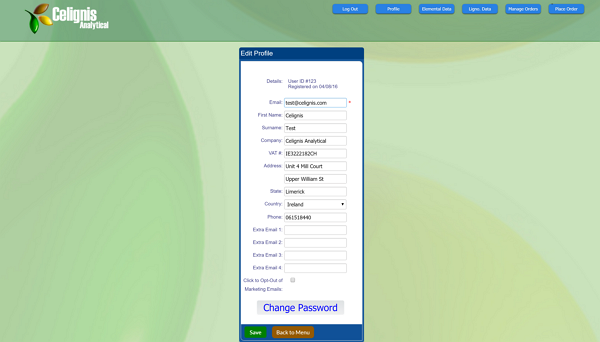
Here you can change the details (e.g. address, phone number etc.) of your user profile. You can also change your password by pressing the "Change Password" button.
You can also add extra email addresses that will receive email updates when we upload new data to the Celignis Database. Up to four additional email addresses can be added, using the "Extra Email 1-4" fields on the page.